How is the NWEA MAP Test Scored?
Enroll NowWhat is included in the NWEA MAP Test Score Report?
Report title.
Grouping: Shows the selection made for optional grouping when the report was requested. Choices are gender, ethnicity, or none (default).
Subject area tested.
Test Type: Test taken, such as S/G (survey with goals).
Growth Measured from shows how your child is doing now, compared to a previous time (if available) the test was taken.
Growth Standard Error: Growth Standard Error (GSE) is an index of the measurement error associated with the change of a student’s scores from one time to another by taking into account the standard error of measurement for each test occasion. A student’s true growth will fall within one GSE of the observed growth about 68% of the time.
Growth Index: RIT points by which the student exceeded the projected RIT (positive values), fell short of the projected RIT (negative value), or met the projected RIT (0) exactly.
The RIT scale is used to chart your student’s academic growth from year to year. Your child’s RIT score is developed when he or she has answered 50 percent of the questions correctly and 50 percent incorrectly, identifies areas of relative strength or weakness and it helps his or her teachers plan for differentiated instruction within curriculum units.
Test RIT: Student’s overall scale score on the current test.
Standard Error of Measurement (SEM): Provides an estimate of the precision of the achievement (RIT) score. The RIT score is accurate within a range of the RIT score plus or minus the SEM. For example, a RIT score of 200 with an SEM of 3 means the RIT score achievement is accurate in the range of 197-203.
Columns and summary statistics are applicable only in Achievement Status and Growth Summary Reports.
Growth Projection: Mean growth observed in the latest NWEA norms study for students who had the same starting RIT score. The values in this column vary with the RIT score. Growth Projection Met: y – yes if the student’s term-to-term growth is equal to or exceeds the growth projection n – no if the growth is less than the growth projection.
Projected RIT: Sum of the current RIT score plus the Growth Projection.
Count of Students with Valid Test Scores: Number of students in the class who have both a valid score and a growth projection.
Mean RIT: Average RIT score of students in the class.
Median RIT: Middle RIT score of this class.
Standard Deviation: Indicates achievement diversity of a group of students. The lower the number, the more students are alike. The higher the number, the greater the diversity in this group.
NWEA MAP Scores and Student Progress Report:
This report taken from the official NWEA Site:
Graph of Student Progress:
The colored line graph depicts a student’s progress and indicates academic ability and tracking with the indicators that follow.
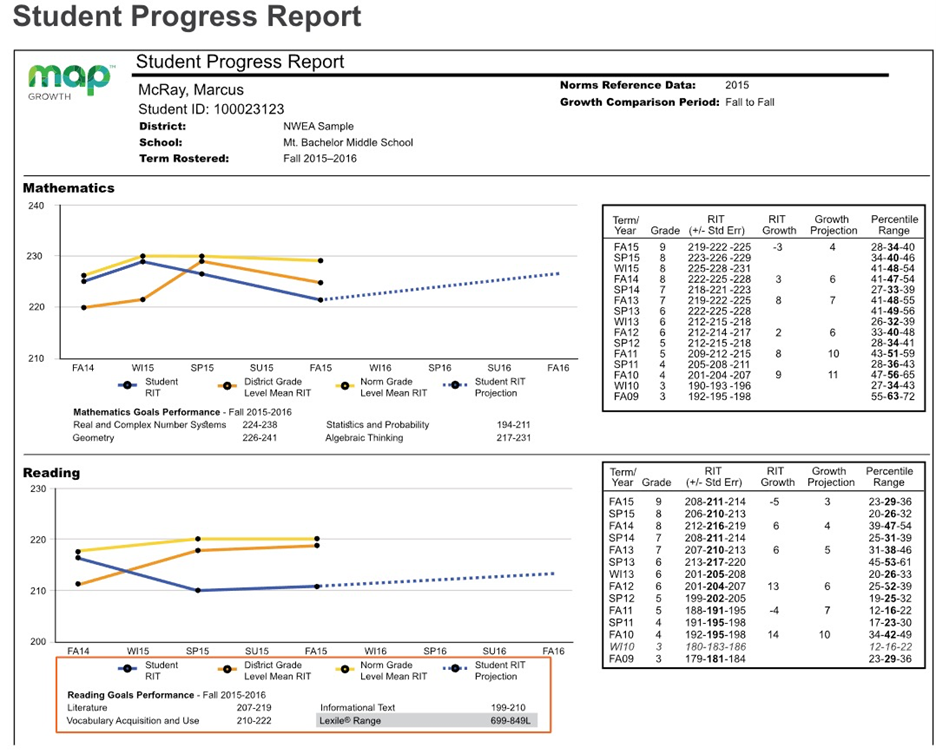
Individual Student Progress: The blue line indicates the student’s progress and gives the parent an idea as to how their child scored on the NWEA MAP test by subject level.
District Grade Level Mean: The orange line indicates the average student’s progress within the district. This allows the parent to look at their child’s score in comparison to other students in the same district that took the NWEA MAP test.
Norm Grade Level Mean RIT NWEA MAP Score: The yellow line indicates the average student progress for students who took the same MAP test at the same time in the rest of the country. This indicator is most useful to teachers to compare how the students in their classroom and in their district are performing compared to students nationwide.
Future Progress Prediction: The dotted line on the MAP testing score chart is a prediction of how well your student will perform in the future based on their past performance. It is the sum of the current RIT score plus the Growth Projection in the table to the right. This is a prediction of your student’s NWEA MAP Score on future tests.
Table of Student Progress:
The tables (above right) track a student’s NWEA MAP test scores and progress from Fall 2009 – 3rd grade to Fall 2015 – 9th grade.
RIT (+/- Std Err): The middle score is the actual NWEA MAP score on this particular test. The score on either side is the score range that the student would likely make if they took the MAP test again in a short period of time.
RIT Growth: This number shows a student’s RIT growth from one test term in one calendar year to another. (Example: FA14 RIT 216 and FA15 RIT 211; therefore, the RIT Growth is -5.)
Growth Projection: This number indicates the average growth of students in the same grade at the same term at a similar RIT score.
Percentile Range: The number in the middle is the student’s percentile rank. It indicates the percentage of students who had an RIT score below this student’s MAP test score. The numbers on either side represent the RIT +/- STD Err of how the student would score if they took the MAP test again within a short period of time.
Want to try us out? Sign up for a free account today and get 100 practice questions.
See if TestingMom.com supports your child’s test by your school district. If you don't see your child's school district listed, check with us! We have practice for other tests as well.
Tell us about your experiences
4 Responses
I am a special education teachers and wonder if there is a table that shows a grade level equivalent to the RIT score. I want it just incase the RIT score does not help the parent to see where their student is in a language they know and understand.
Thanks!
I am looking for MAP test for both ELA and Math practice questions?
My son is 1st grade student and he has RIT 182 score on math and RIT 186 score for reading, please advise,
Thank you,
Susan
Our school only uses the Screening MAP test, not the MAP Growth test. When my son finished the test it just gives a number. How can I make sense of this number? Is the Screening Test as accurate as the Growth Test?